Pavement Management Plan
In January 2024, The Transportation Department developed a Pavement Management Plan (PMP) to summarize the current citywide street condition and to identify strategic investment needs that will ensure the network is efficiently maintained. It was the first plan of its kind for the City, as the Department proactively identifies funding needs to provide a reliable transportation network for the community. The Pavement Management Plan relied on the most recent pavement condition assessment (2023) conducted by the Department to create a comprehensive, data-driven strategy that answers key pavement management questions. The Pavement Management Plan Report outlines the Department’s functions and processes related to pavement management, historical and recent pavement condition assessment information, funding history, needs, and scenarios for achieving a goal of PCI 70, and implementation considerations, including a Five-Year Plan identifying streets targeted for improvement. The Five-Year Plan is intended to inform the public and stakeholders on the specific streets and associated repair activities that will be conducted citywide if funding is identified. The Five-Year Plan is available on the City’s website at streets.sandiego.gov.
Pavement Management Plan Annual Update
The Fiscal Year (FY) 2025 PMP update is the first annual update to the Plan and provides a summary of the FY 2024 accomplishments, establishes goals for FY 2025, provides an update on the newly established in-house paving team, and summarizes funding needs for future fiscal years. The annual update follows the strategic approach outlined in the original PMP, incorporating the Performance Audit of the City’s Street Maintenance Program recommendations and focusing on the long-term sustainability of the City’s street network.
The FY 2025 Pavement Management Plan Update
Who is Responsible for Pavement Management within the City?
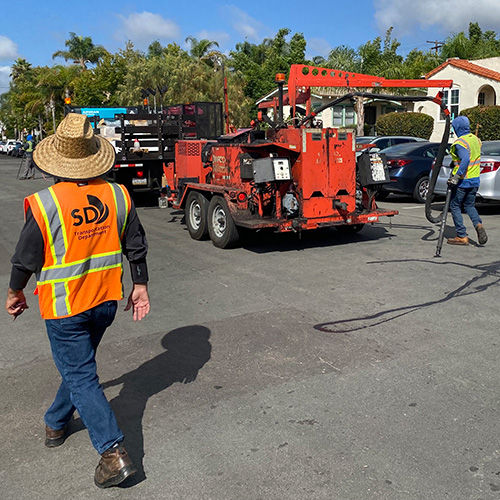
There are over 100 staff members within the Transportation Department that are dedicated to maintaining and improving the City’s pavement condition, comprised of nine in-house teams that perform pothole repair, mill and pave trench restoration, and planning, design, and construction oversight of paving projects. The Transportation Department is the lead department within the City for planning and implementing pavement management projects, but the Department coordinates closely with other City departments, including Engineering & Capital Projects, Planning, Stormwater, Public Utilities and Development Services, to provide a functional and viable transportation network throughout the City.
More information on how the City manages pavement can be found in the Executive Summary of the PMP report.
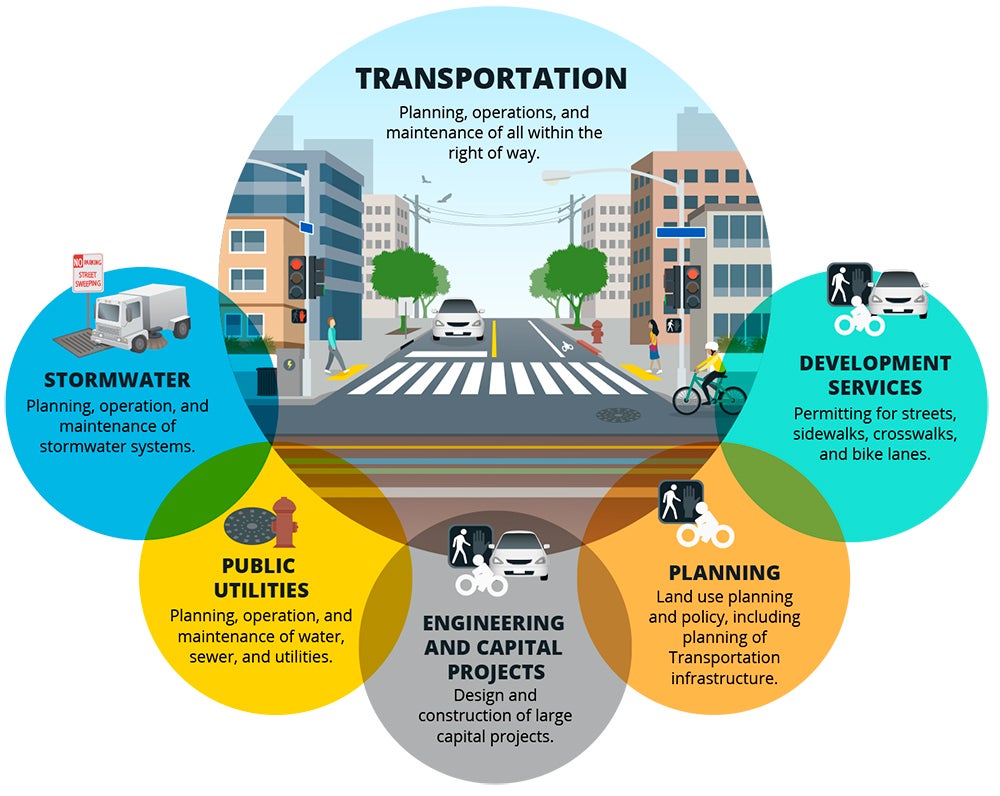 Full image description: The Transportation Department is responsible for a multitude of transportation related services and requires coordination with various departments. This figure shows the relationship between the Transportation Department and the Stormwater, Public Utilities, Engineering and Capital Projects, Planning, and Development Services Departments. Transportation is responsible for planning, operations, and maintenance of all within the right of way. Stormwater is responsible for planning, operation, and maintenance of stormwater systems. Public Utilities is responsible for planning, operation, and maintenance of water, sewer, and utilities. Engineering and Capital Projects is responsible for design and construction of large capital projects. Sustainability and Mobility is responsible for master planning of sidewalks, crosswalks, and bike lanes. Development Services is responsible for permitting for streets, sidewalks, crosswalks, and bike lanes.
What is the City's Current Pavement Condition Index?
The Pavement Condition Index (PCI) is the most widely used method for assessing and reporting street pavement conditions. The PCI scoring scale ranges from zero (worst) to 100 (best) and provides a common language for pavement practitioners to describe and communicate pavement conditions. PCI scores are used to help the City choose the appropriate maintenance and repair treatment types for each street.
In 2023, the City conducted a pavement condition assessment and determined that the average street network PCI is 63, which is within the Fair category. This is a decrease from the 2016 assessment, which determined the PCI was 71. By the end of Fiscal Year 2025, the PCI is projected to be at 65 due to recent increased investments in the paving program.
More information on the City's PCI can be found in Chapter 2 of the PMP report.
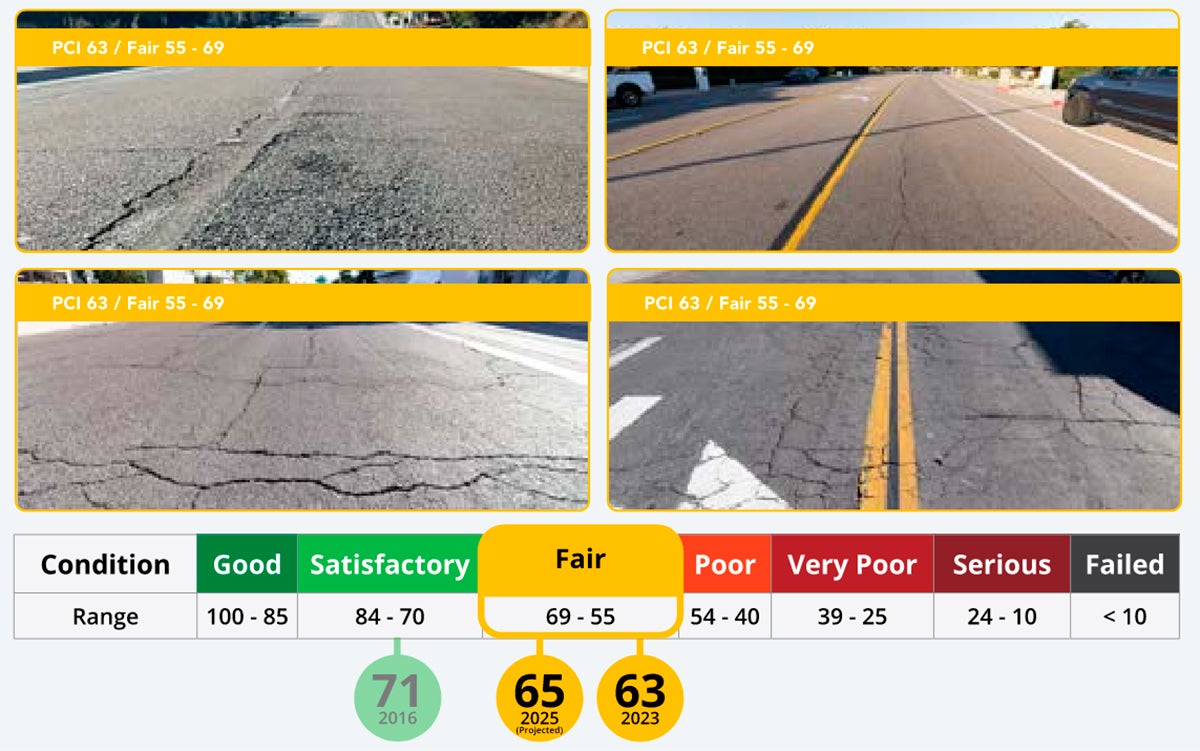 Full image description: The City uses a Pavement Condition Index (PCI) scale to score pavement conditions. Figure X shows four photo examples of a street with a PCI of 63 which falls within the Fair category of the scale. Additionally, the scale shows the average City street network PCI was 71 in 2016, 63 in 2023, and 65 in 2025.
How does the City maintain and rehabilitate streets?
To address signs of distress and extend the pavement's lifespan, a systematic approach to street maintenance is crucial. The specific treatment for a given street segment depends on the PCI (Figure C). As a street's PCI deteriorates, more expensive treatments are required to improve the pavement condition, emphasizing the need to maintain an average network PCI of 70 or greater and reduce the costs to improve the network. The City uses various treatment types on the street network, ranging from proactive management of minor cracks and damage through crack seals and surface seals to more expensive rehabilitation treatments, such as asphalt overlay, through complete reconstruction, which is the most expensive treatment.
For more information about maintenance and rehabilitation activities performed by in-house department crews and contractors, please see the PMP report.
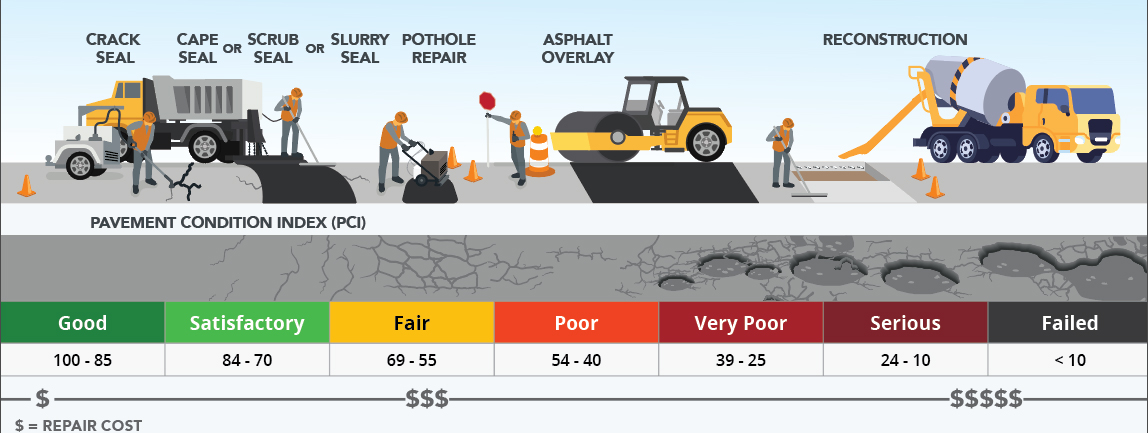 There are several pavement repair and rehabilitation types that the Transportation Department uses including crack seal, slurry seal, cape seal, pothole repair, asphalt overlay, and reconstruction. Treatment costs increase according to the severity of street damage. Repair types such as crack seal are typically used to repair small cracks for streets that fall within the Good or Satisfactory categories while reconstruction is required for streets that fall within the Serious and Failed categories.
Pavement Management Funding Needs
The January 2024 Pavement Management Plan incorporated a financial analysis using multiple street selection approaches to assess cost-effective and operationally viable options to achieve an average PCI 70. At that time, Department analyses determined that to maintain an average street network PCI of 70, a total investment of $1.9 billion is needed over the next 10 years.
The FY 2025 PMP provides an update to three different funding scenarios listed below based on actual funding received in FY 2025 and anticipated funding in FY 2026. Each funding scenario also provides the corresponding average street network PCI output over the next 10 years. These scenarios include:
Scenario 1: Current Anticipated Funding Scenario
Scenario 2: Funding Scenario to Reach PCI of 70
Scenario 3: Funding Scenario to Maintain the Current Condition (PCI of 65)
More information on the Transportation Department's funding needs can be found in Chapter 3 of the PMP report and Chapter 4 of the updated FY 2025 Pavement Management Plan.
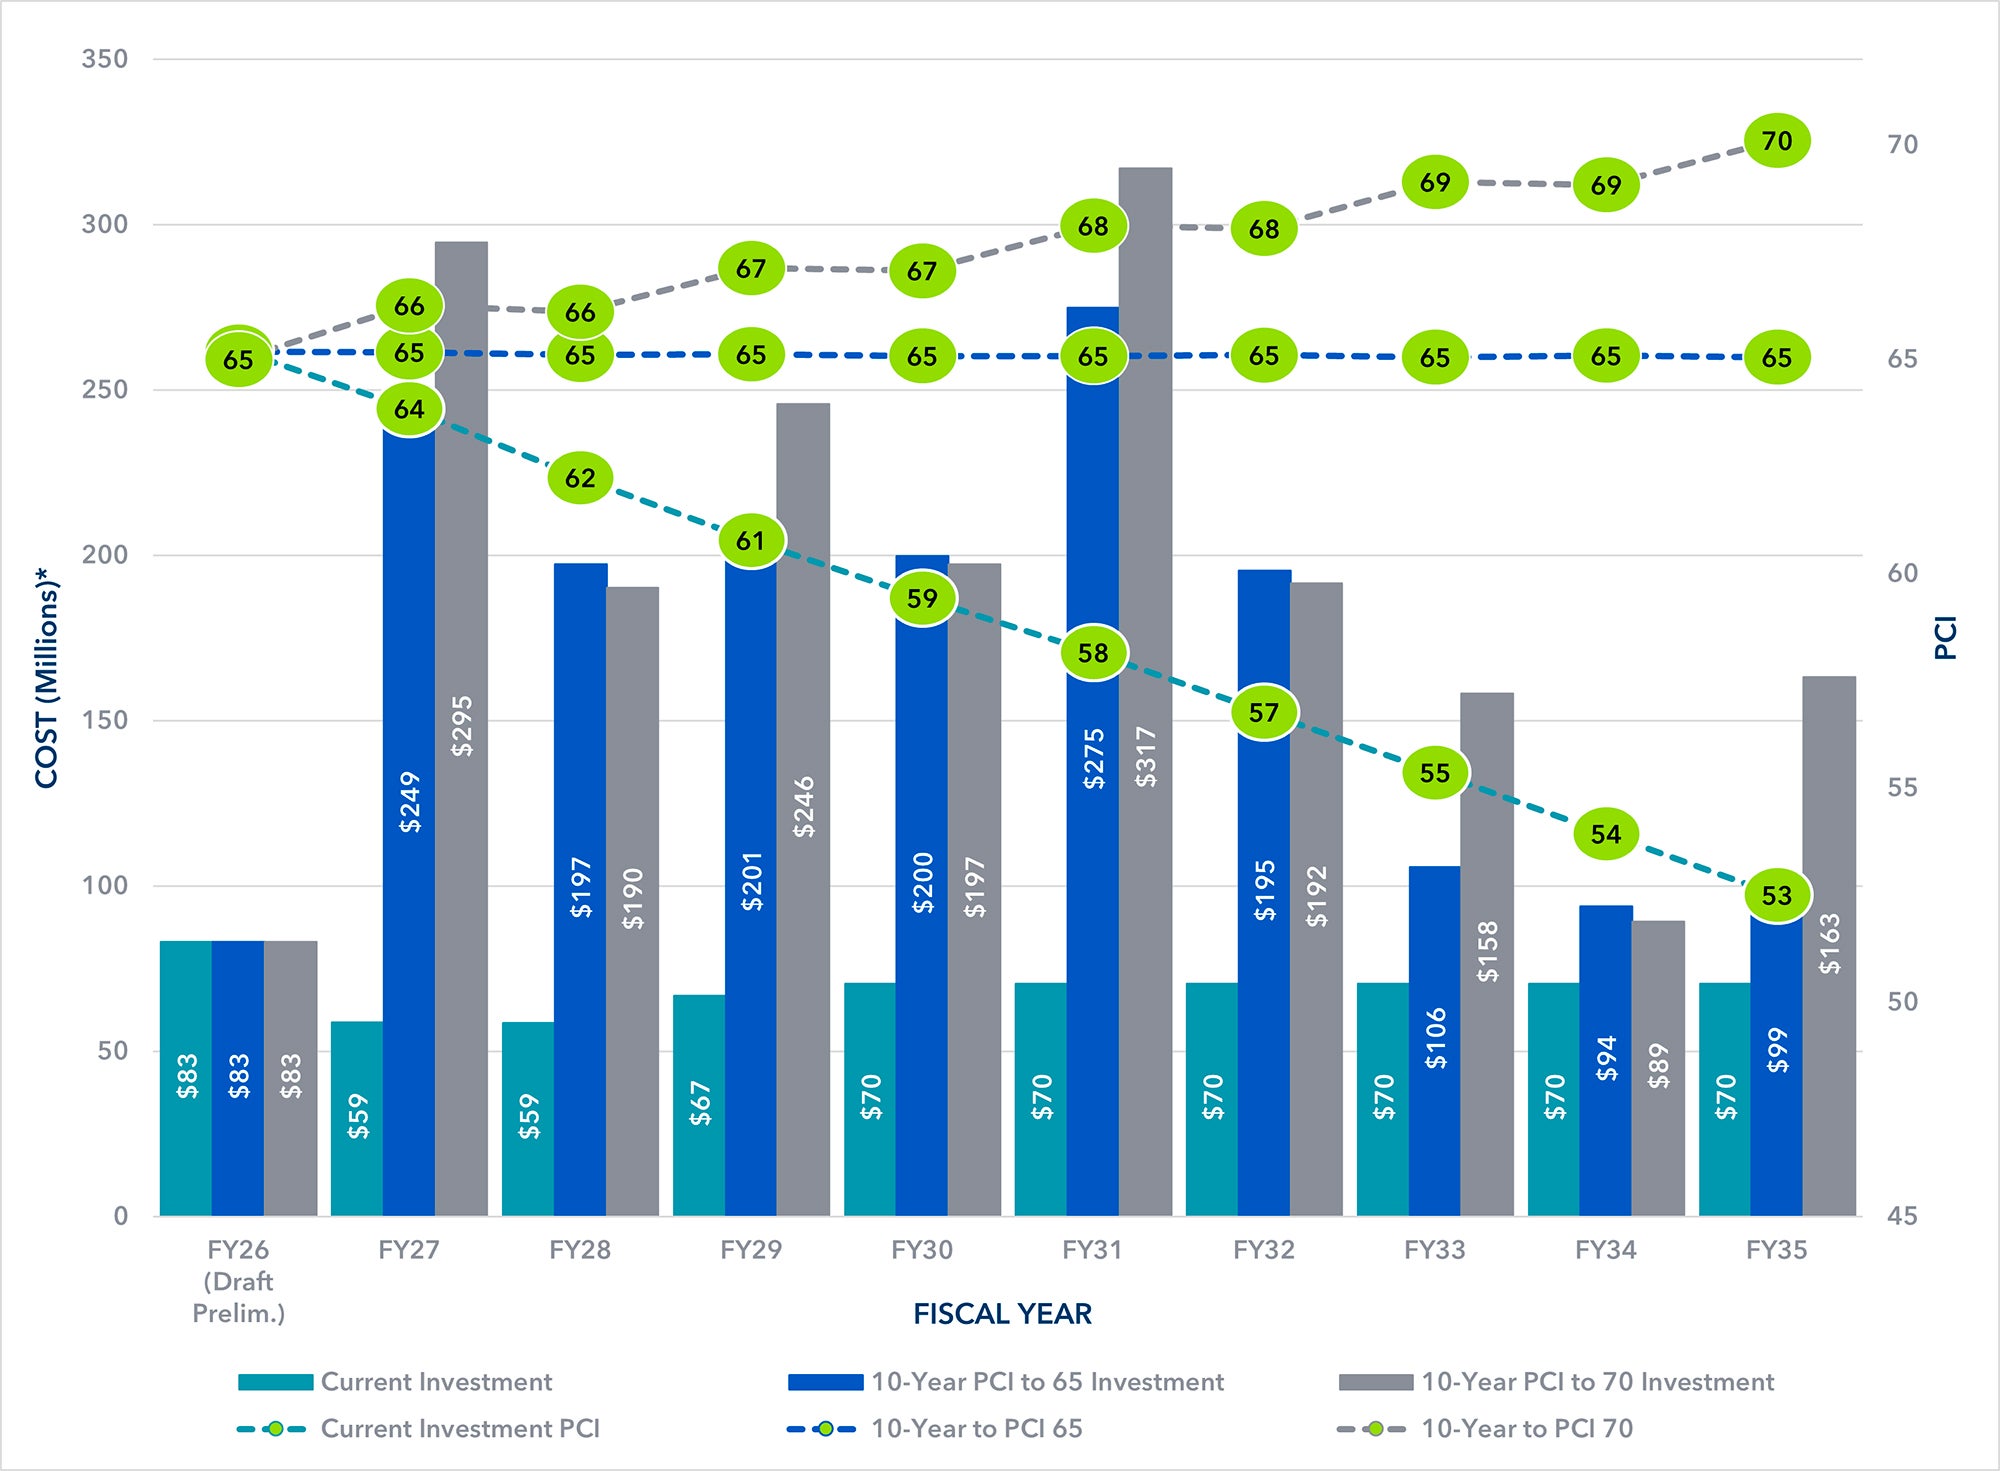
Full image description: Current Department funding projections are not sufficient to improve the average City street network's PCI. Figure D uses a column chart to compare the average annual funding required over a 10-year period and the resulting PCI for both the Best Value Approach PCI 70 10-Year Implementation Scenario and the Current Projected Funding Scenario. Using the current funding, the PCI would decrease to a PCI of 45 over the next 10 years despite investing $646 million total. If the Best Value Approach PCI 70 10-Year Implementation Scenario is applied, a total of $1.9 billion total would be required but would increase the PCI to 70 in just 8 years.
In-House Paving Assessment
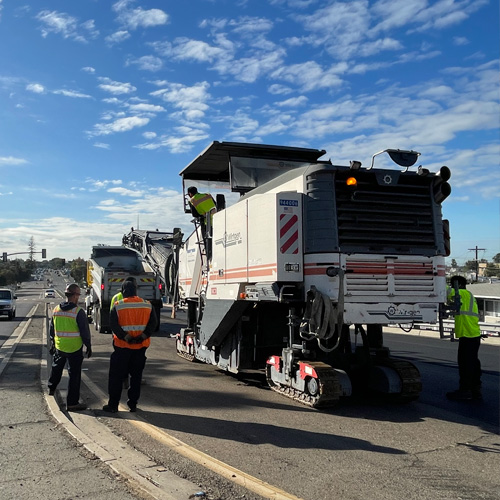
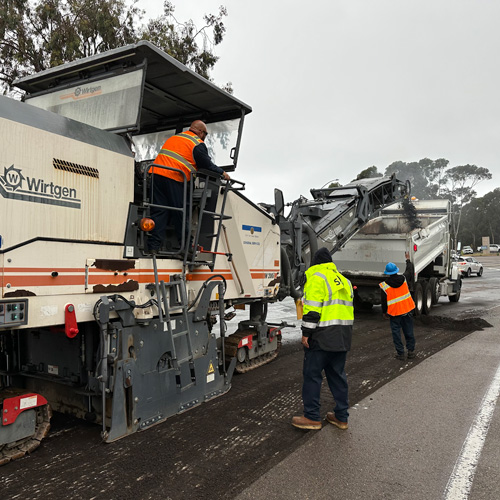
As part of the Department’s effort to evolve and optimize pavement maintenance and rehabilitation projects, a cost and feasibility assessment was done to evaluate the potential benefits of performing paving projects in-house utilizing City equipment and personnel. It was determined that the City would benefit from performing more mill and pave work in-house. In Fiscal Year 2025, two new mill and pave teams were established. These teams were funded as part of the City’s ongoing efforts to improve its street network and reduce reliance on external contractors. In FY 2025, the in-house mill and pave teams are performing curb-to-curb pavement work, targeting streets that are in “poor” to “failed” condition that will not be addressed through contractor-based projects, ensuring that critical streets receive timely rehabilitation. In FY 2025, the goal of the in-house paving team is to complete 20 lane miles of rehabilitation. These teams enable the City to expand its reach and efficiently tackle smaller-scale projects and streets that won’t be completed via contractors.
More information on the costs to perform more paving in house can be found in Appendix B of the PMP report.
More information on the funded mill and pave teams can be found here.
Five-Year Paving Plan
The Department has prepared a Five-Year Plan that shows what streets would be paved in the next five fiscal years if the Department were to receive the funding requested in the Pavement Management Plan. The Five-Year Plan is displayed on the Streets SD website. The street segments in the Five-Year Plan will be updated annually as the funding amount becomes known. The Five-Year Plan is subject to change based on secured funding amounts and conflict checking with other projects.
Resources Available to Residents
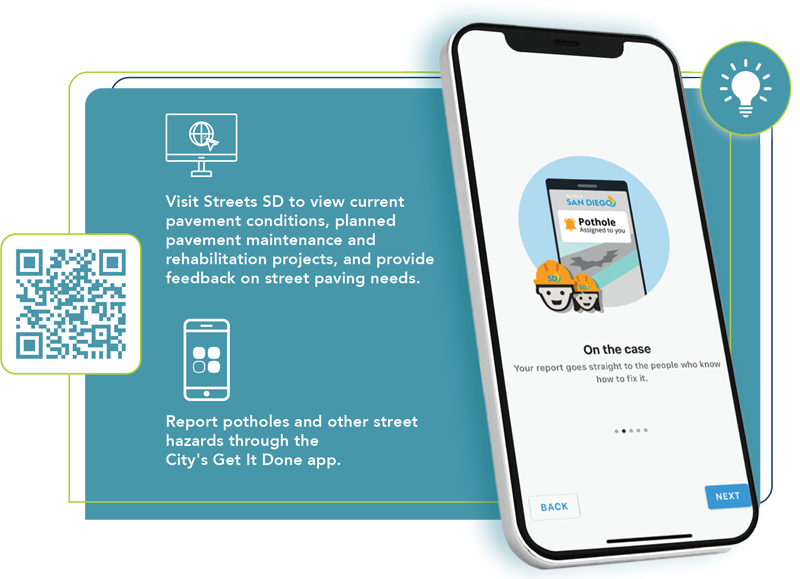
The Department is committed to ensuring transparency and accessibility of information for residents regarding the City's street infrastructure. To provide real-time insights, the Department has established a user-friendly website, streets.sandiego.gov, where residents can access detailed information about the current condition of each road segment in the City. This online platform also features updates on ongoing and planned maintenance and rehabilitation projects, empowering residents to stay informed about the City's efforts to enhance road quality.
Additionally, residents can provide feedback on street paving needs through streets.sandiego.gov. Residents can quickly and efficiently report potholes directly through the Get It Done application and also view current street conditions in their Council District by going to Appendix A of this Pavement Management Plan.
Additional Resources
- 2024 Pavement Management Plan
- Executive Summary
- Chapter 1 - Introduction
- Chapter 2 - 2023 Pavement Condition Assessment
- Chapter 3 - Funding Needs
- Chapter 4 - Pavement Management Plan Implementation & Considerations
- Chapter 5 - Conclusion
- Appendix A - Council District Maps
- Appendix B – In-House Paving Assessment
- Appendix C – Five-Year Plan Street List
- Appendix D – References
- 2023 Street Pavement Condition Map


